Starting Out 3: Joining Team Names to Your Data
Quick, what does team 321 do well? Unless you've got every number at your event memorized, you probably can't answer that without going and looking it up. But you'd probably recognize the team by name in a second. Numbers are great for computers, but names are what actually stick in your head. This post is about getting team names into your dashboard, right alongside all the data you've already been working with.
Every export we provide, from the individual submissions file to the averaged Download Data file, only have the Team Number column in them to identify the team. That's on purpose; team numbers never change and never get spelled two different ways, so they're what we use to keep everything matched up correctly behind the scenes. But it does mean that every slicer, filter, and chart you build is stuck showing plain numbers unless you give it something better to work with.
That's what the new Team List link on your event page is for.
What's new: the Team List page
On your event page, you'll now see a Team List link. Click it, and you'll get a simple page with nothing fancy on it at all... it's just a table with two columns, Team Number and Team Name, one row per team registered for that event. That's the whole thing. But it's exactly the ingredient we were missing before: a second, small table that we can bring into Power BI and connect to the data table you're already using.
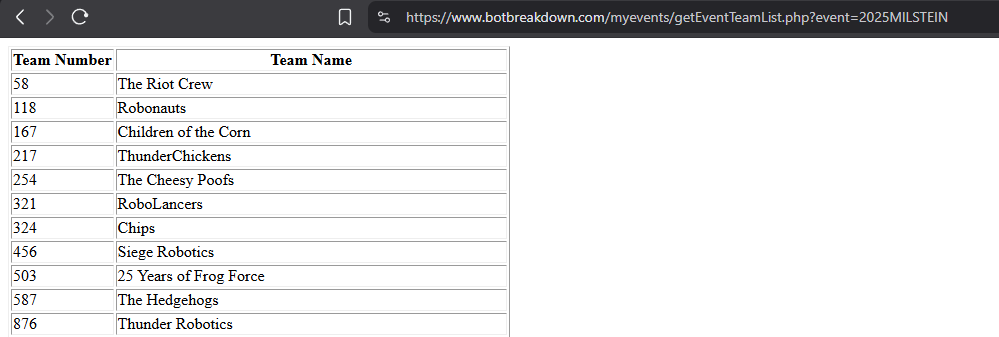
If you ever want to find it again without clicking through, the page lives at /myevents/getEventTeamList.php?event={code}, where {code} is your event's code (the same way our other event links work).
Step 1: Import the Team List as its own table
You don't need to download anything for this one; Power BI can read a table straight off a web page.
- In Power BI, click Get Data > Web.
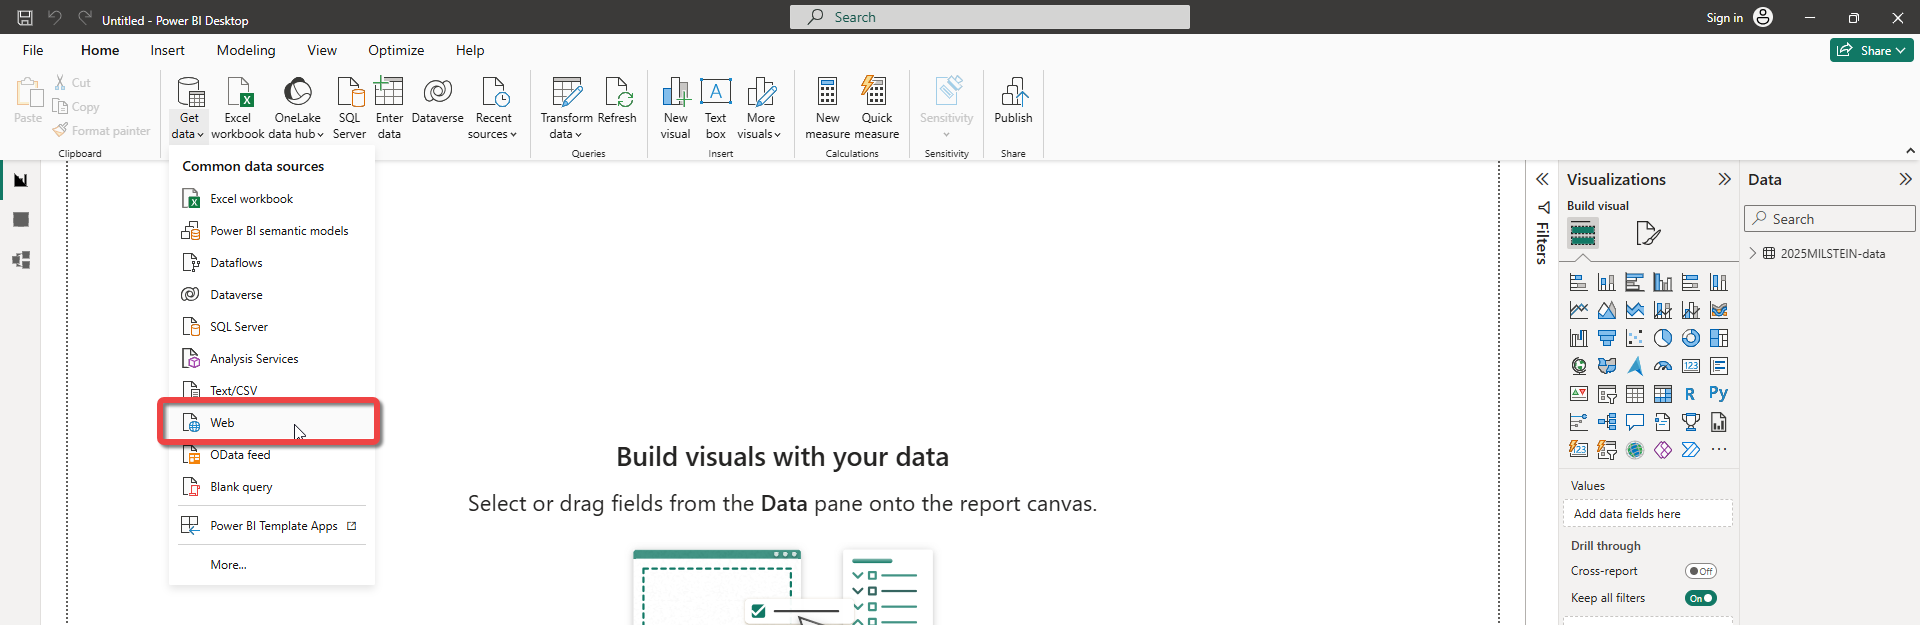
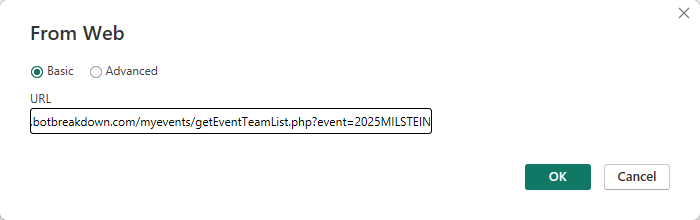
- Paste in your Team List link and click OK.
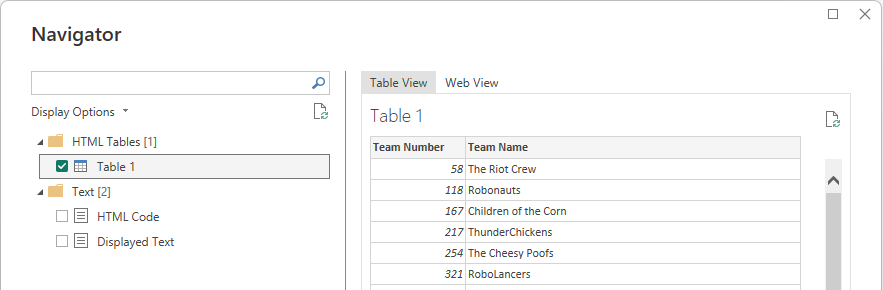
- Power BI will show you a Navigator window with a preview of what it found on the page. You should see one table listed with your Team Number and Team Name columns. Select it, and click Transform Data (not Load; we want to double check a couple of things first).
- In the Power Query editor, check the data type of the Team Number column (look at the little icon in the column header, or the type shown on the Changed Type step). Make sure it matches the type your existing data table uses for its own Team Number column: both should be Whole Number, not Text. This matters a lot in the next step: two columns can only be joined together if Power BI agrees they're the same kind of thing, not just the same digits.
- While you're here, it's worth renaming this query to something clear, like Teams, using the Query Settings panel on the right. That's the name you'll see later when picking fields for your visuals.
- Click Close & Apply.
You should now have two tables loaded: your usual submissions or match data, and this new, much smaller Teams table.
Step 2: Connect the two tables together
Right now, Power BI may have no idea that these two tables are related; they're just sitting next to each other. To fix that, switch to the Model view (look for it in the icons running down the left side of the Power BI window).
You'll see both of your tables represented as boxes, each listing their columns. What we want is a line connecting the Team Number column in one table to the Team Number column in the other. That line is called a relationship, and it's what lets Power BI look up a team's name whenever it sees that team's number, without you having to type anything out by hand.
- Click and drag from Team Number in your data table directly onto Team Number in the Teams table.
- Power BI will draw a line between them and open a dialog confirming the relationship. It should detect this as a many-to-one relationship automatically, meaning many rows in your data table (one per team per match) all point to the single matching row in your Teams table (one per team). That's exactly what we want, so you can just click OK.
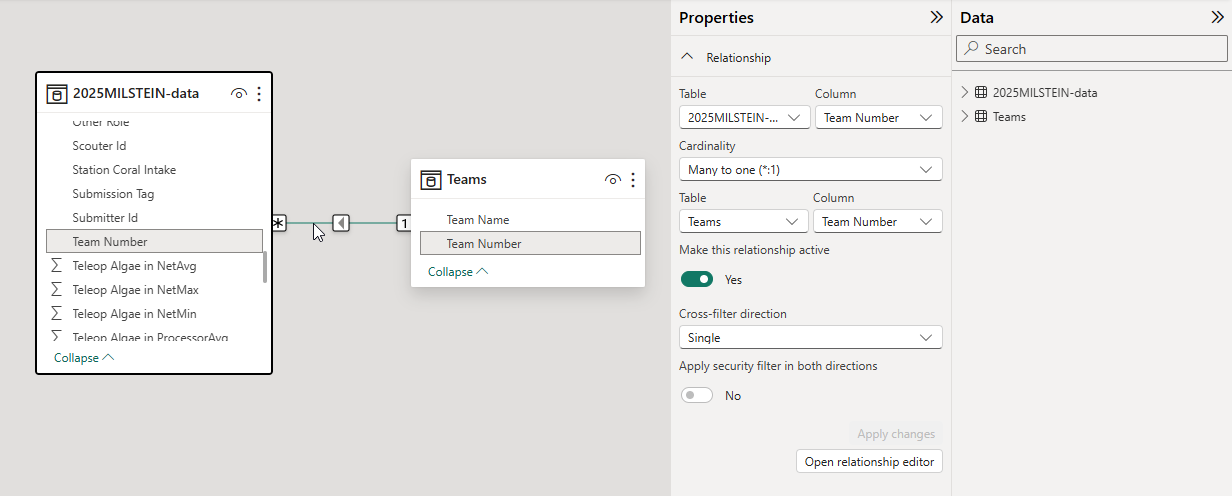
If Power BI already auto-detected this relationship for you when you loaded the data (it sometimes does, when column names match closely enough), you'll just see the line already there in which case there's nothing left to do. You can always double check any relationship, or build one by hand, from the Manage Relationships button on the Home tab.
Step 3: Use Team Name anywhere you'd normally use Team Number
This is the payoff. Head back to the Report view, and anywhere you'd normally drag in Team Number, try Team Name from the Teams table instead:
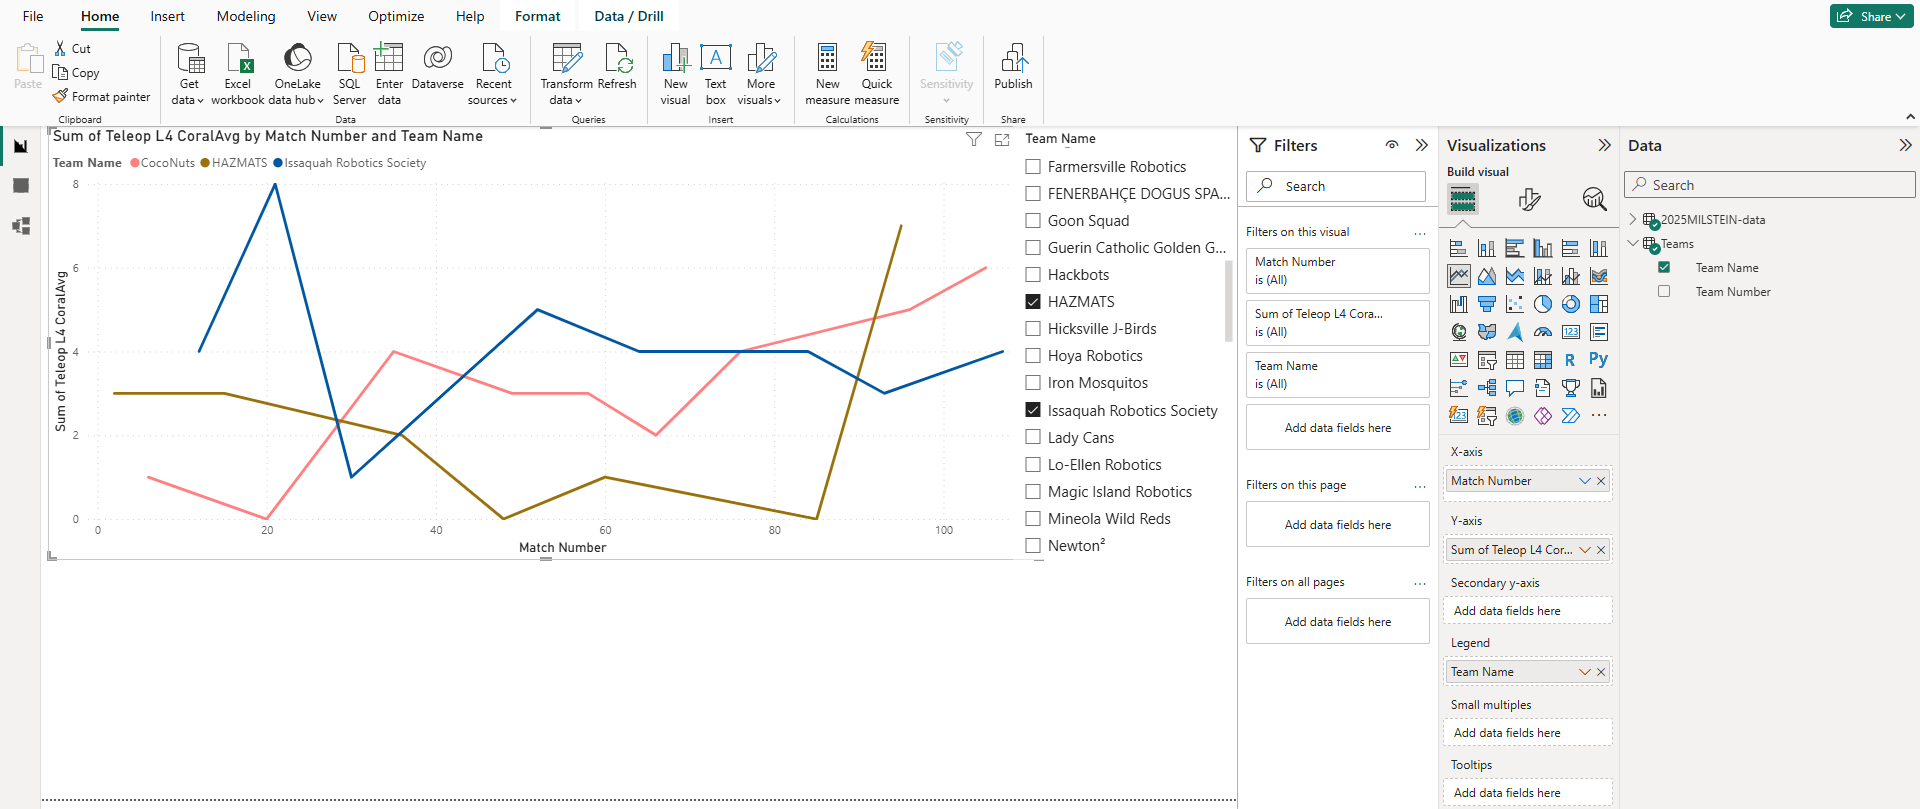
- Slicers: swap Team Number for Team Name, and your filter list turns from a wall of digits into an actual, readable list of teams. Selecting a name still filters everything correctly, because of the relationship you just built: Power BI quietly translates the name back to the matching number behind the scenes.
- Tooltips: select a chart that shows one point per team (a scatter chart is a great example) and drag Team Name into the Tooltips field well alongside whatever's already there. Now hovering over any point tells you who it is, not just what number they wear.
- Axis labels and legends: on charts where Team Number is being used as a category or legend, Team Name usually works as a direct swap, and instantly makes the chart easier for anyone else on your team (including future you) to read.
None of your existing formulas or columns need to change for any of this; you're not replacing Team Number anywhere in your data, you're just giving your visuals a second, friendlier way to refer to the same thing.
One more thing
This same trick - using Get Data > Web to pull in a small table from a page and joining it to your main data on a shared column - isn't limited to team names. Any time you find yourself wishing you had one more piece of context sitting next to a number in your data, it's worth asking whether there's a page somewhere with exactly that table on it, ready to be joined in the same way.
Happy scouting!