Beyond Average: Mining the 2026 Shooting-Session Data
If you scouted with us this season, you already know the big new field on the form: instead of just tallying up total pieces, scouters are now starting a timer every time a robot starts actively shooting fuel, and stopping it when the robot stopped. Most robots will therefore end up with a handful of separate "sessions": a burst in Auto, then more once Teleop opens up.
Behind the scenes, we save all of a robot's bursts for a match together in one data field, as a little chunk of text. That's a lot more information than a single "pieces scored" number, but it's locked inside that text field unless you know how to open it up. This post walks through exactly that: how to get the right file, how that chunk of text is organized, and a set of formulas you can copy, tweak, and drop straight into your own dashboard even if you've never written a formula like this before.
We'll build these examples in Power BI (a free tool from Microsoft for building dashboards), using its "Power Query" editor. If your team is more comfortable in Excel, don't worry: Excel has the exact same editor built in (look for "Get & Transform Data" or "Power Query" on the Data tab), and every formula below works there without any changes.
Step 1: Get the right file
This is the part that might be a change for you this season. The "Download Data" buttons you're used to on the site still work, and it's still the fastest way to get a single row per team per match. But that convenience comes at a cost: when more than one scouter submits data for the same team and match, we can't average two of these session text-chunks together, so that column just gets both scouters' chunks stuck together with a blank line in between. That breaks the formulas in this post (more on how to work around it later, if you still want to use that file).
For anything involving shooting sessions, you want the raw submissions instead. This gives you one row per scouter, per team, per match, with every field left exactly as it was submitted. To get it:
- Go to your event page and click Show actual event submissions.
- Click Export Submissions. (this links to
/myevents/viewsubmissions.php?event={code}if you ever need to find it again). - Save the CSV somewhere you'll remember - we'll import it in a minute.
Step 2: What's actually inside that chunk of text
Open the CSV in a text editor for a second and look at the Auto Sessions or Tele Sessions column for any row. You'll see something like this (though for the sake of keeping the data size small it's usually all on one line):
[
    {"id":"tSess1","t":3.6,"a":30,"s":65.22},
    {"id":"tSess2","t":4.7,"a":10,"s":17.54}
]
It looks messy, but it's actually just a list, written out as text. The square brackets [ ] hold the list, and each { } group inside it is one item in that list... in this case, one shooting burst. Inside each burst, you get a few labeled pieces of information, separated by colons, the same way you might jot down "time: 3.6, amount: 30" on a notepad.
This particular way of writing a list-of-labeled-info as text has a name: JSON. You'll see that term a lot if you look at how other scouting or analytics tools store data - it's an extremely common format, not something specific to us. You don't need to memorize the name to use it; you just need to recognize the shape: square brackets around a list, curly braces around each item, and "label": value pairs inside.
Here's what each label means for a shooting session:
- id: an internal label the tool uses to keep sessions straight. You won't need this for analysis.
- t (short for time): how many seconds that burst lasted.
- a (short for amount): the estimated number of fuel pieces scored during that burst.
- s: a score value we calculate, not a real game score. It rewards scoring more pieces in less time, so a fast, dense burst is worth more "s" than a slow one with the same number of pieces.
Side note: there's also a data field for the Composite Score, which is just the total of all of the s values for a submission. So you can stick with just that composite score if you want... but there's extra value in getting out what makes it up as you'll see. The composite score is useful for ranking bursts against each other, but it isn't an official point value from the game itself.
An empty list ([]) just means that scouter didn't record any shooting for that phase. That's normal, and our formulas below will treat it as zero rather than an error.
The important thing here isn't the specific labels; it's the shape. Any time you have a text field holding a JSON list of items, the pattern below works. Swap Auto Sessions for whatever your column is called, and swap t, a, or s for whatever label you want to look at.
Step 3: Import and set up the query
- In Power BI, click Get Data > Text/CSV, select your submissions export, and click Transform Data to open the Power Query editor instead of loading it directly.
- Power Query will auto-detect column types and add a Changed Type step. Leave that in place: our formulas below build on top of it.
- On the Add Column tab, click Custom Column for each formula below. Give it a name, paste in the formula (everything after the name in a
Table.AddColumncall goes in the formula box), click OK, and repeat. - When you're done adding columns, click Close & Apply on the Home tab to load everything into your data model.
How to read one of these formulas
Before we throw a wall of formulas at you, here's what all the pieces mean, so you can actually change them instead of just copy-pasting blind. Take our simplest one:
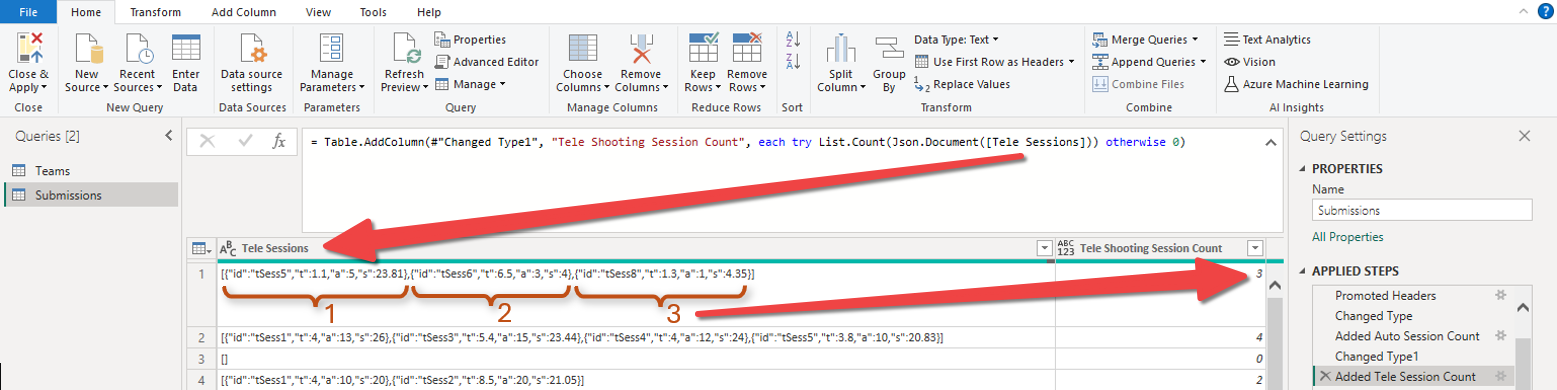
= Table.AddColumn(#"Changed Type", "Auto Shooting Session Count", each try List.Count(Json.Document([Auto Sessions])) otherwise 0)Reading it left to right:
Table.AddColumn(#"Changed Type", "Auto Shooting Session Count", ...)- this just means "add a new column, call it Auto Shooting Session Count, and here's how to calculate it for every row."each ...- "do the following for each row, one at a time."try ... otherwise 0- a safety net. If anything inside goes wrong (say, the text field is blank or broken), use0instead of showing an error. This is why you'll seetry/otherwisewrapped around almost everything below; scouting data is messy, and we'd rather get a zero than have one bad row break the whole column.Json.Document([Auto Sessions])- this is the step that actually turns the JSON text in the Auto Sessions column into a real list that Power Query can work with, instead of just a string of characters. Think of it as "unpacking" the text.List.Count(...)- once it's unpacked into a list, count how many items are in it.
Put together: "unpack the text in Auto Sessions into a list, count how many sessions are in it, and if anything goes wrong just use 0."
Now here's a slightly more involved one: the same idea, but instead of just counting sessions, it reaches inside each one and pulls out a number:
= Table.AddColumn(#"Changed Type", "Tele Median Shooting Time", each try
    let
        parsed = Json.Document([Tele Sessions]),
        values = List.RemoveNulls(
            List.Transform(parsed, each try Number.From(Record.Field(_, "t")) otherwise null)
        )
    in
        if List.IsEmpty(values) then 0 else List.Median(values)
otherwise 0)
let ... in ...- this just lets us break the calculation into named steps instead of writing one giant line. Think of it like showing your work: defineparsed, then definevaluesusingparsed, then use both in the final answer afterin.parsed = Json.Document([Tele Sessions])- same unpacking step as before: turn the text into a real list of sessions.List.Transform(parsed, each ...)- go through the list one session at a time, and for each one, do something and remember the result. Here, for every session we grab one number out of it.Record.Field(_, "t")- for whichever session we're currently looking at (that's what the underscore_means: "the current item"), grab the value labeled"t". Swap"t"for"a"and you'd be grabbing the number of pieces they scored instead of looking at the time.Number.From(...)- make sure it's treated as a number, not text.List.RemoveNulls(...)- throw out anything that didn't come back with a valid number.if List.IsEmpty(values) then 0 else List.Median(values)- if there were no valid sessions, use 0; otherwise, take the median of all the numbers we collected.
So this one says: "unpack Tele Sessions, pull the time (t) out of every session, and give me the middle value ... or 0 if there were no sessions at all."
That's really the whole trick: which field you grab (t, a, or s) and which summary function you use at the end (List.Median, List.Average, List.Max, List.Min, List.Sum) are the two things worth changing to build your own version. Everything else is scaffolding you can leave alone.
More formulas built the same way
Average pieces of fuel per session: same shape as above, but grabbing "a" instead of "t", and averaging instead of taking the median:
= Table.AddColumn(#"Changed Type", "Auto Average Session Fuel", each try
    let
        parsed = Json.Document([Auto Sessions]),
        values = List.RemoveNulls(
            List.Transform(parsed, each try Number.From(Record.Field(_, "a")) otherwise null)
        )
    in
        if List.IsEmpty(values) then 0 else List.Average(values)
otherwise 0)
Longest single burst: same shape again, grabbing "t" and using List.Max instead of List.Median. Useful for spotting a robot that can really camp and just keep shooting:
= Table.AddColumn(#"Changed Type", "Longest Shooting Burst", each try
    let
        parsed = Json.Document([Tele Sessions]),
        values = List.RemoveNulls(
            List.Transform(parsed, each try Number.From(Record.Field(_, "t")) otherwise null)
        )
    in
        if List.IsEmpty(values) then 0 else List.Max(values)
otherwise 0)
Combining Auto and Tele together: sometimes you don't care whether a burst happened in Auto or Tele; you just want a robot's total fuel scored across the whole match. The & symbol glues two lists together end to end, so we can unpack both columns and combine them before adding everything up:
= Table.AddColumn(#"Changed Type", "Total Fuel", each try
    let
        autoValues = List.Transform(Json.Document([Auto Sessions]), each try Number.From(Record.Field(_, "a")) otherwise 0),
        teleValues = List.Transform(Json.Document([Tele Sessions]), each try Number.From(Record.Field(_, "a")) otherwise 0)
    in
        List.Sum(autoValues) + List.Sum(teleValues)
otherwise 0)
Rate of fire: session length and pieces scored are each useful on their own, but dividing one by the other gives you pieces-per-second, which is a fairer way to compare a robot with three short bursts to one with a single long burst. Since the rate needs to be calculated per session, the division happens inside List.Transform, before we summarize:
= Table.AddColumn(#"Changed Type", "Average Fuel per Time", each try
    let
        sessions = Json.Document([Auto Sessions]) & Json.Document([Tele Sessions]),
        rates = List.Transform(sessions, each try Number.From(Record.Field(_, "a")) / Number.From(Record.Field(_, "t")) otherwise null),
        clean = List.RemoveNulls(rates)
    in
        if List.IsEmpty(clean) then 0 else List.Average(clean)
otherwise 0)
Swap List.Average for List.Median or List.Max and you've got a robot's typical rate of fire versus its best-ever burst... two different (and both useful) numbers.
A simple one, for comparison
Not every useful column needs any of this unpacking. This is the same "combine two columns" technique from our very first Power BI post, but with this season's field names ... a nice one to add right alongside your session formulas:
= Table.AddColumn(#"Changed Type", "Total Composite", each [Auto Composite Score] + [Tele Composite Score])Wait... didn't we just lose the averaging?
Good question if you're thinking about it. The "Download Data" file gives you one row per team per match, already averaged for you whenever more than one scouter watched. The raw submissions file we've been using in this post doesn't do that: if two people scouted team 9432 in match 12, you'll have two separate rows for it, one per scouter, each with its own set of formula columns sitting right next to it.
That's not actually a problem; it just means the averaging hasn't happened yet, instead of happening too early to be useful. Rather than averaging the raw numbers before they ever reach Power BI (which is what breaks the JSON, as we saw above), we let every individual scouting report in as its own row, and let Power BI do the combining for us at the moment we actually build a chart or table. It can combine rows by adding them, averaging them, taking the biggest or smallest, and more... we just have to tell it which one we want.
Here's the part that isn't obvious the first time you see it: any time you drag a numeric column into a visual, Power BI automatically finds every row that belongs together and combines them into a single number, based on whatever else is in that same visual. If your chart's category is Team Number, every row for that team (across every match and every scouter) gets combined into one value. If your chart's categories are Team Number and Match Number together, only the rows that share both of those get combined. For us, that means exactly the handful of scouters who watched that one team in that one match. Either way, you end up with one number per dot, bar, or cell, no matter how many rows fed into it. And don't forget this all works with the team name too, if you've linked in the Teams table for the event.
By default, Power BI combines numbers by adding them together (called Sum), which usually isn't what we want here; two scouters both reporting "3 sessions" for the same robot shouldn't turn into "6 sessions" on your chart. To fix it:
- Drag a column, like Auto Shooting Session Count, into a visual's field well (for example, the Y-axis of a chart, or the Values of a table).
- Look for a small dropdown arrow that appears next to its name once it's in that field well, and click it.
- You'll see a short list of ways to combine matching rows: Sum, Average, Minimum, Maximum, Count, and a couple of others. Choose whichever function makes the most sense for what you're viewing.
Do this for each formula column you drag into a visual, and you'll get exactly what you'd expect: one value per team per match, averaged across however many scouters were watching. This is the same idea as the old "Download Data" file, but it's computed live instead, from data that still has every scouter's original JSON intact underneath it.
One thing this dropdown can't give you directly is a median across scouters... and my team knows how much I love using Median instead of Mean/Average for some data so you know I've run into that a lot! Most versions of Power BI only offer Sum, Average, Minimum, Maximum, and Count in that list. (To be clear, that's different from the medians we've already been calculating with List.Median earlier in this post; those are medians across a robot's own shooting sessions, computed once per row, and they're unaffected by any of this.) A true median across scouters would need something Power BI calls a measure (a formula that looks at an entire visual's worth of rows at once), rather than one row at a time like every custom column in this post. That's a bigger topic than we can fit here, but it's worth knowing the door exists if you go looking for it.
Turning these into visuals
Once you've got a few of these columns, they slot into visuals the same way any other numeric field does:
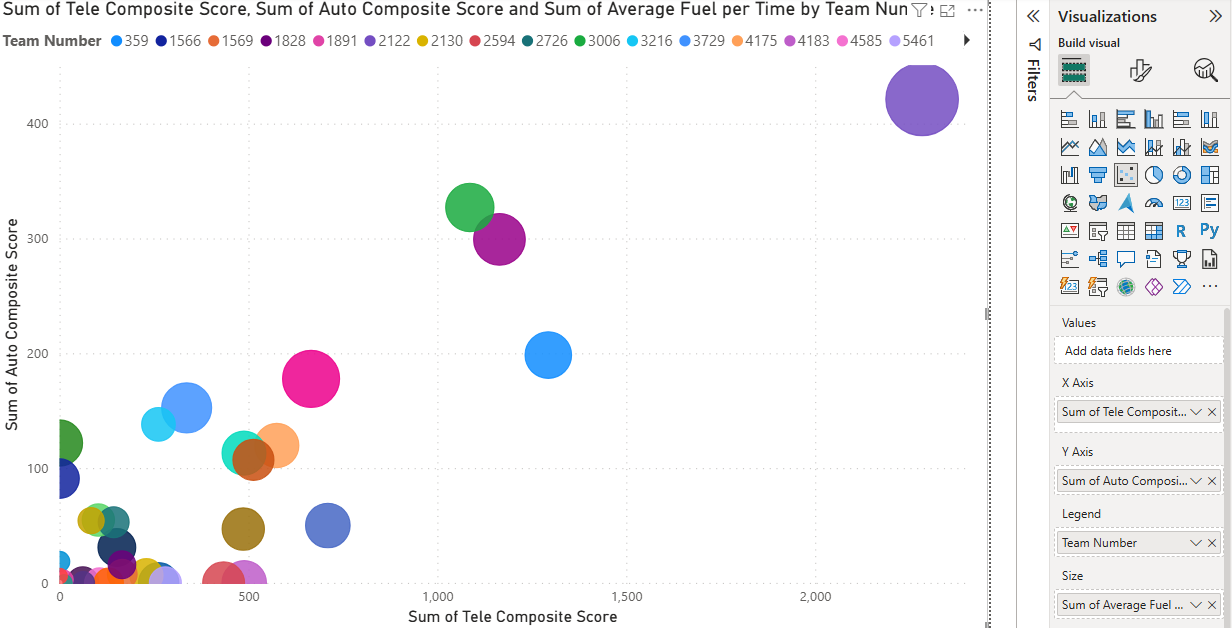
- Scatter chart: X = Tele Composite Score, Y = Auto Composite Score, Legend = Team Number, Size = Average Fuel per Time. This gives you the classic "who's good at what" bubble chart, but now bubble size tells you something about how they're scoring, not just how much.
- Ranked bar chart: Team Number on the axis, Median Fuel per Time as the value, sorted descending. Add a slicer on Team Number so you can pin a handful of alliance candidates side by side.
- Line chart: Match Number on the X axis, Auto Shooting Session Count and Tele Shooting Session Count as two series, filtered to one team at a time with a slicer. This is a good way to spot a robot that got more (or less) consistent as the event went on.
One field we won't be covering here: Auto Coordinates. That column holds most of the data behind the little robot-path maps you see on the site; it's built for drawing an image, not for charting, so there isn't a straightforward way to bring it into a Power BI visual. It's worth knowing it's there, but we'd leave it out of your dashboard.
Bonus round: getting creative with the classic Download Data file
The averaged "Download Data" export is still genuinely useful: it's one row per team per match, which despite everything we've talked about above, may prove to be exactly what you want. Its one quirk, as mentioned above, is that when multiple scouters cover the same team and match, columns that can't be averaged (like our session data, but also things like Comments) get stuck together with a blank line between each scouter's value, instead of being combined into one. (Fortunately the Composite Scores can be averaged, so if that's all you want, you're good to go with the classic "Data" file).
But, knowing that the strings of text from multiple scouters are just stuck together this way, you can actually turn that quirk into a feature. A couple of ideas:
How many scouters covered this match? Split the text on that blank line and count the pieces: Text.Split is a much simpler cousin of Json.Document, it just cuts a chunk of text apart wherever it finds a separator you give it (here, a blank line):
= Table.AddColumn(#"Changed Type", "Scouter Count", each List.Count(Text.Split([Tele Composite Score], "#(lf)#(lf)")))How much did your scouters disagree? Split the same way, turn each piece into a number, and look at the gap between the highest and lowest value reported. A large gap is a good signal to go pull up the match video and sort out who was right:
= Table.AddColumn(#"Changed Type", "Tele Composite Spread", each
    let
        parts = List.Transform(Text.Split([Tele Composite Score], "#(lf)#(lf)"), each try Number.From(_) otherwise null),
        clean = List.RemoveNulls(parts)
    in
        if List.IsEmpty(clean) then 0 else List.Max(clean) - List.Min(clean)
)
What share of the alliance's score came from this robot? The allianceResults column that we load from the FIRST data automatically (also JSON, and it survives the averaging process cleanly since it's identical no matter who's scouting) has the alliance's final score. Combine it with the Alliance column to pick the right side and calculate a percentage:
= Table.AddColumn(#"Changed Type", "Share of Alliance Score", each
    let
        results = Json.Document([allianceResults]),
        allianceScore = if [Alliance] = "Red" then results[scoreRedFinal] else results[scoreBlueFinal]
    in
        if allianceScore = 0 then 0 else ([Auto Composite Score] + [Tele Composite Score]) / allianceScore
)
A table visual sorted by Tele Composite Spread, with the match video link from allianceResults right next to it, makes a genuinely useful scouting-QA tool... and a table sorted by Share of Alliance Score is a quick way to find robots that are quietly carrying their alliances.
Final thoughts:
Keep in mind: none of these formulas are the one "right" answer... they're just a starting point. That's the whole point of this tool; we're crowd-sourcing the scouting but leaving the analysis to your team! But we do want to make sure that you've got some basic patterns to make the data useful. So using the samples above, change the field you grab, change the summary function, change what you're filtering on, and see what you find that we haven't. And make an incredible alliance!
Happy scouting!